Fleet operations at national scale
A multi-product platform for managing a national fleet, four products, three designers, 900 operational users.
The problem, as defined
The agency had grown its fleet faster than its tooling. Stakeholders described it as "a redesign". Inspectors, technicians, dispatchers, and fleet managers were each working from a different spreadsheet on top of three legacy systems. The ask: make it look like one product.
What I found
It was not a redesign problem. It was an architecture problem with a UI mask. Most "feature requests" were missing connections between products the agency already owned. Fixing the screens without fixing the model would have moved the bottleneck one step downstream.
An architecture before any screens
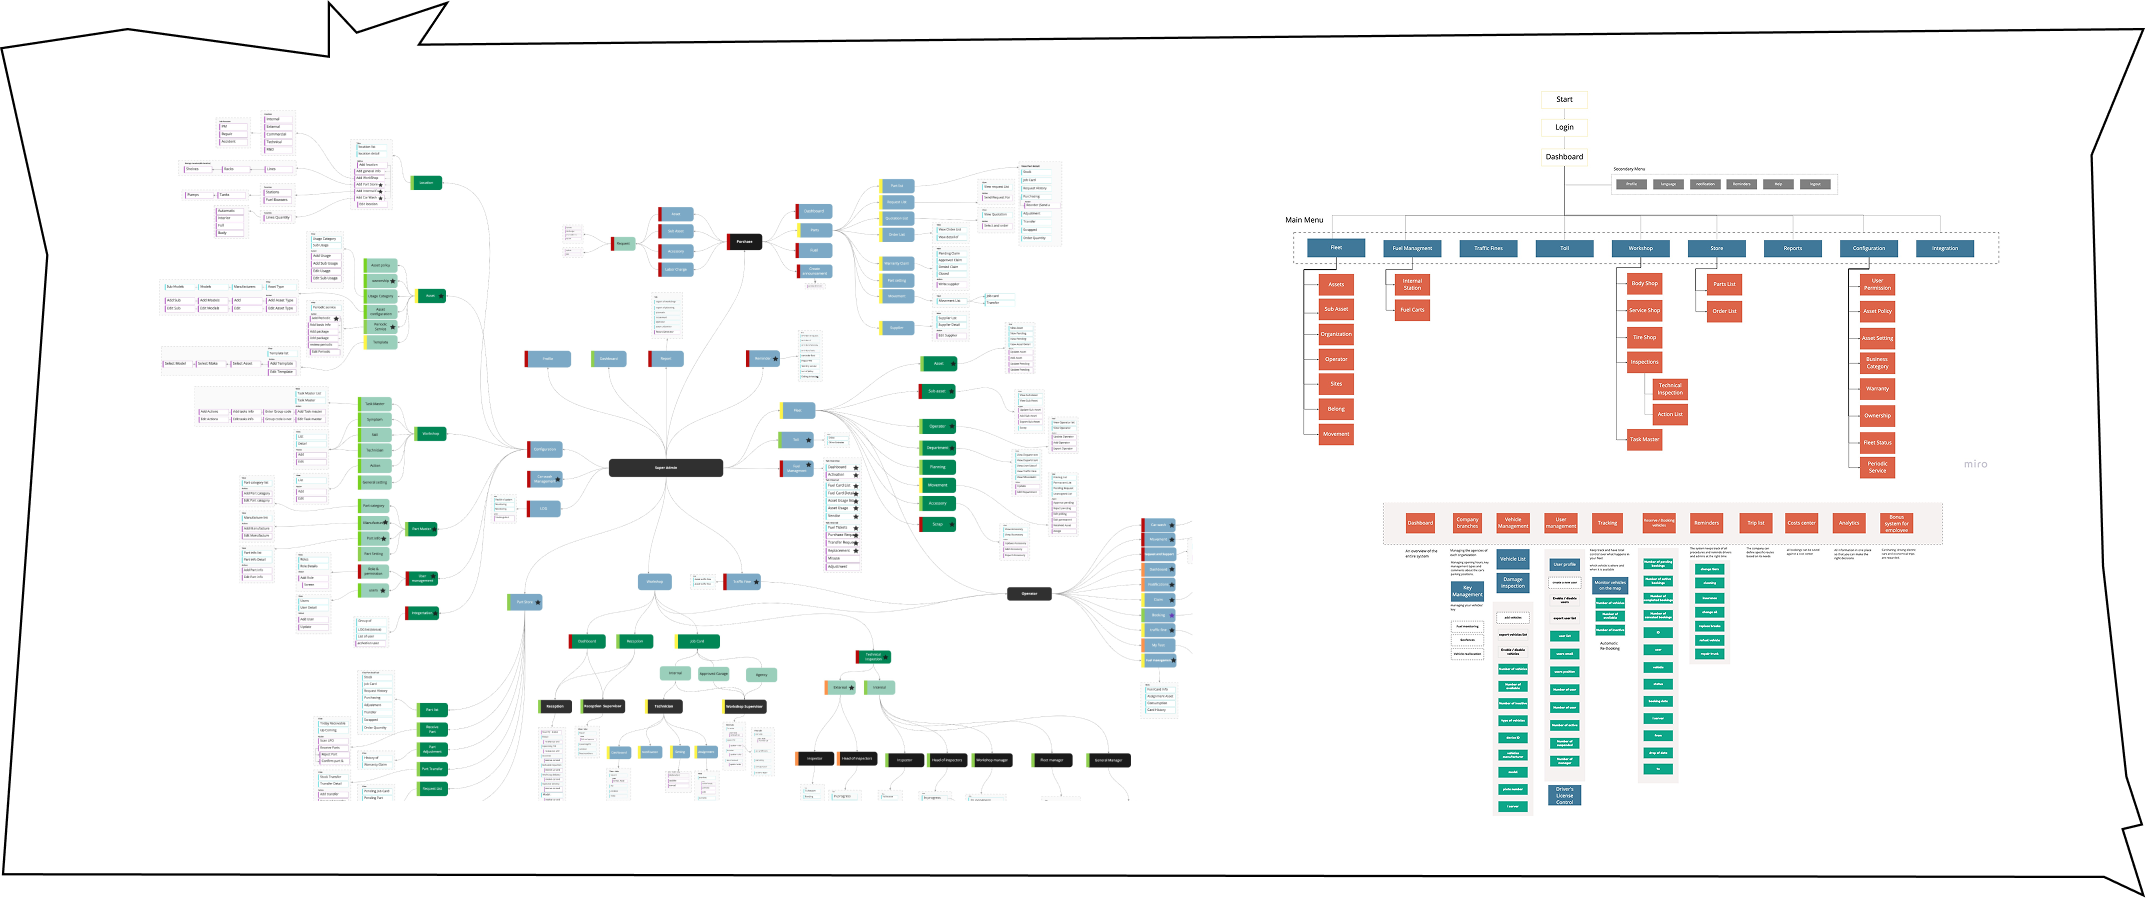
I refused to design a screen for the first three months. We started with the architecture. One map covering every actor, every entity, every state transition, and the system boundary between products. The map became the contract, if a feature did not have a home on this page, it did not have a home in the platform.
The first weeks were not at a keyboard. They were inside garages, on the phone with dispatchers, watching inspectors fill paper forms. That work fed the map directly. By the time the agency saw it on a wall, the senior team recognised their own operation in it, and the conversation moved from "what should we build" to "in what order".
Flows that match how the work happens
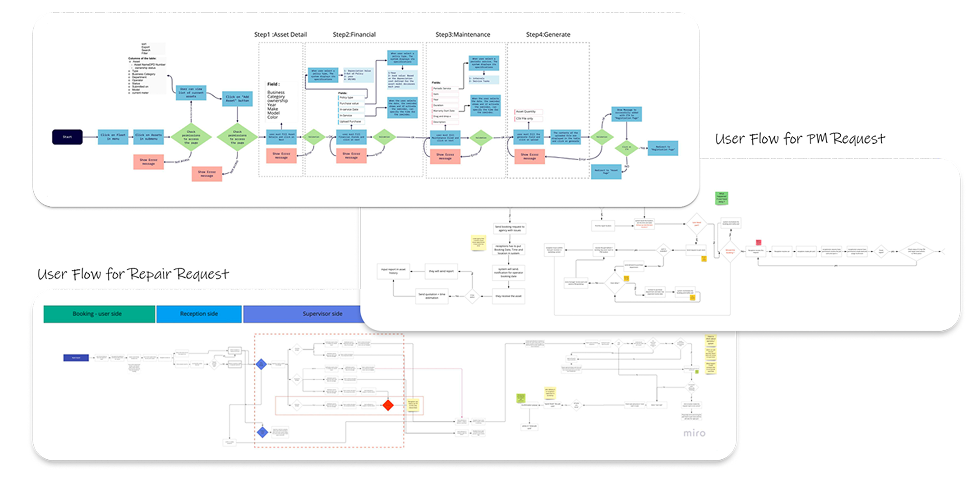
Once the architecture was settled, we drew flows for the two transactions that drove the platform's value, preventive maintenance and repair. These were not happy-path flows. They captured the agency exceptions, supervisor approvals, and multi-side handoffs between booking, reception, and the workshop.
Designers and engineers shared the same flow file. Operations reviewed it before any UI was made. By the time a screen got drawn, the argument about "what should happen here" was already settled.
The tradeoff that shaped the design
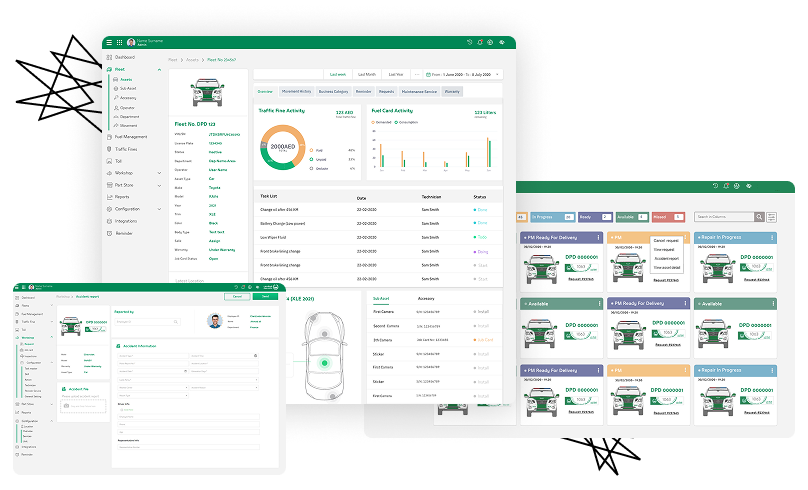
Density against approachability. Operational users want every piece of information on one screen. New users want one decision at a time. We resolved it with role-based density, the same data model presented differently per role. Inspectors got dense tables with inline editing. Senior management got summary dashboards. One backend, one component library, two surfaces.
One design system, four products
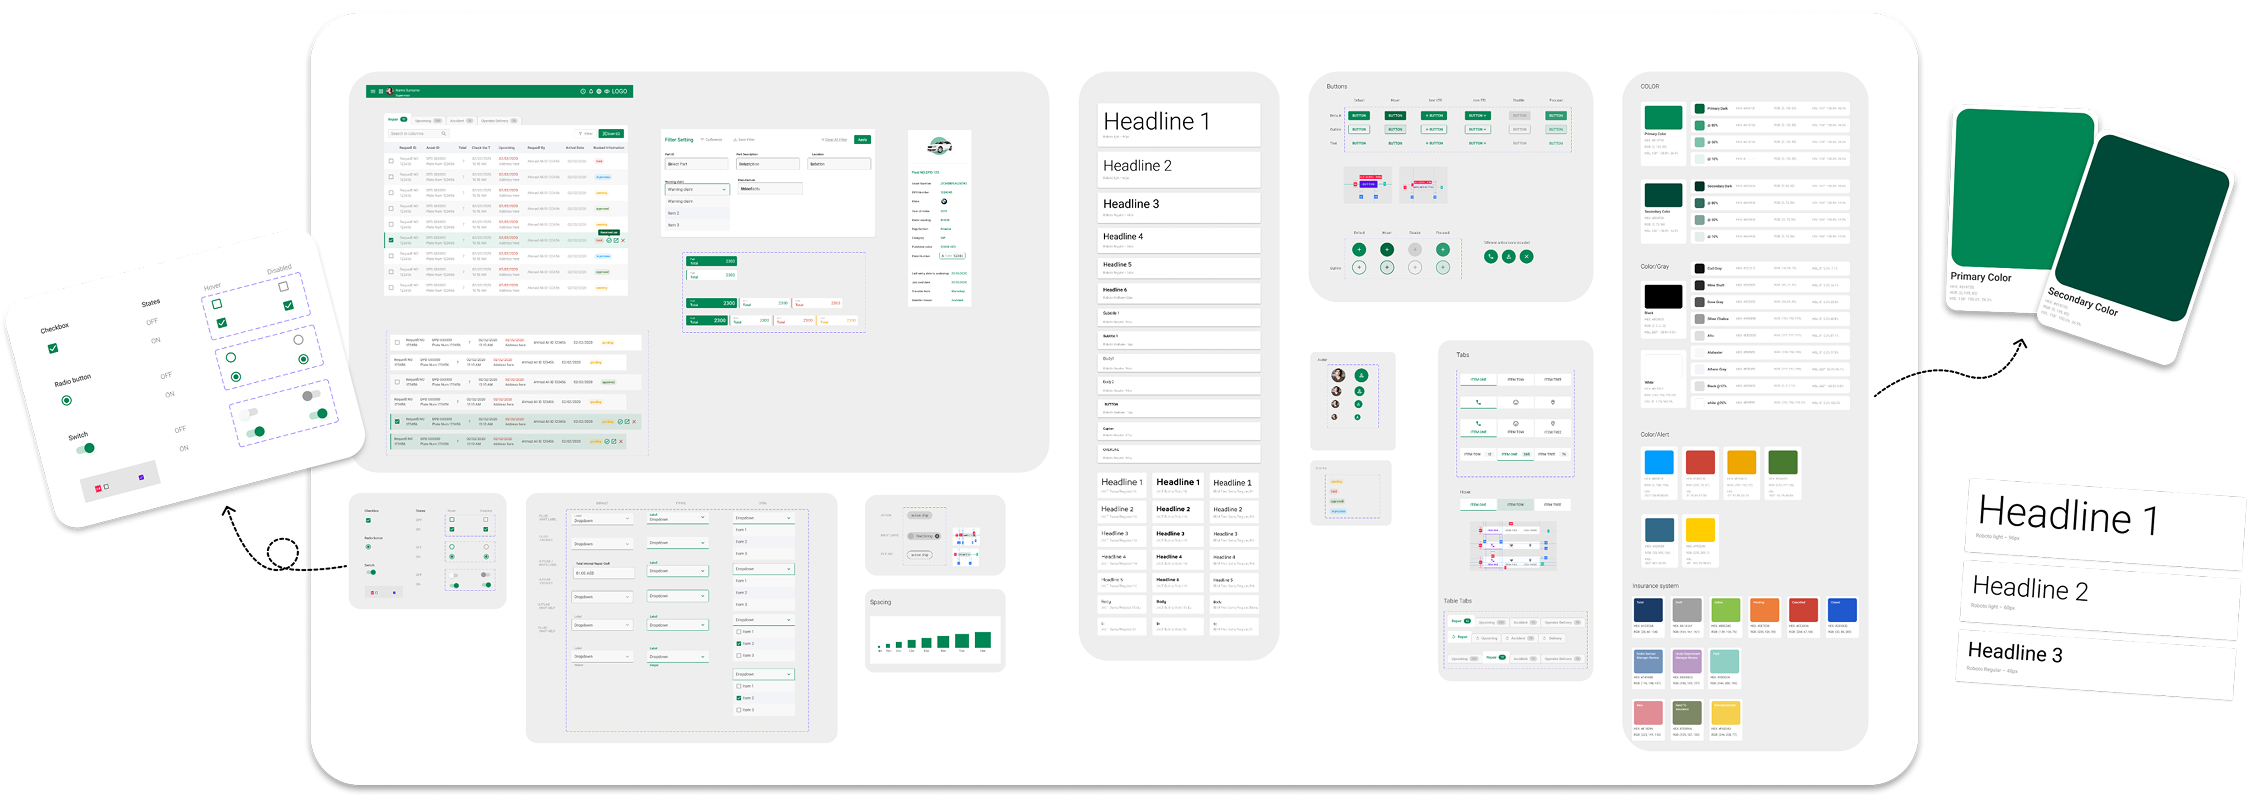
The design system was not optional. With three designers, four products, and a multi-year backlog, the only way to stay coherent was to build the components, tokens, and patterns first, then assemble screens from them.
The system covered colour, type, controls, tables, filters, tabs, status pills, and the agency's domain-specific patterns, asset chips, role-based density, status workflows. Anything that recurred more than twice became a token or a component. Everything else stayed a one-off and got reviewed as such.
Outcomes
- Four products shipped on a shared design system, used daily by around 900 operational staff across inspection, workshop, dispatch, and fleet management.
- Cross-product navigation time reduced after the unified information architecture replaced the previous three-system patchwork.
- Time-to-onboard new operational hires dropped because patterns repeated across products.
- Design-engineering pairing time shrank as the component library matured, more screens from the same primitives.
Caveat: directional figures based on internal benchmarks; exact numbers under government NDA.
The platform is the design system
At this scale, the platform is the design system. Screens are throwaway. Tokens, patterns, and role-density rules are what actually compound. Three years on, the original screens have been redrawn. The system is still the system.